您现在的位置是:网站首页> 编程资料编程资料
Pandas 内置的十种画图方法_python_
![]() 2023-05-25
513人已围观
2023-05-25
513人已围观
简介 Pandas 内置的十种画图方法_python_
前言
Pandas是非常常见的数据分析工具,我们一般都会处理好处理数据然后使用searbon或matplotlib来进行绘制。但在Pandas内部就已经集成了matplotlib,本文将展示Pandas内部的画图方法。
画图类型
在Pandas中内置的画图方法如下几类,基本上都是常见的画图方法。每种方法底层也是使用的matplotlib。
line : line plot (default)
bar : vertical bar plot
barh : horizontal bar plot
hist : histogram
box : boxplot
density/kde : Density Estimation
area : area plot
pie : pie plot
scatter : scatter plot
hexbin : hexbin plot
在进行画图时我们有两种调用方法:
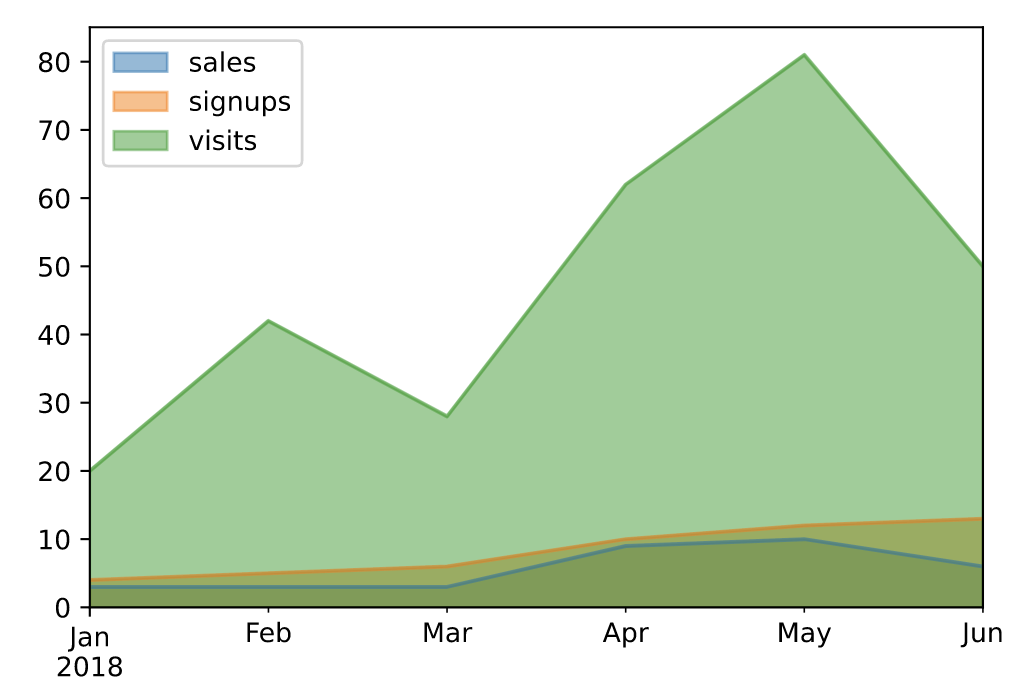
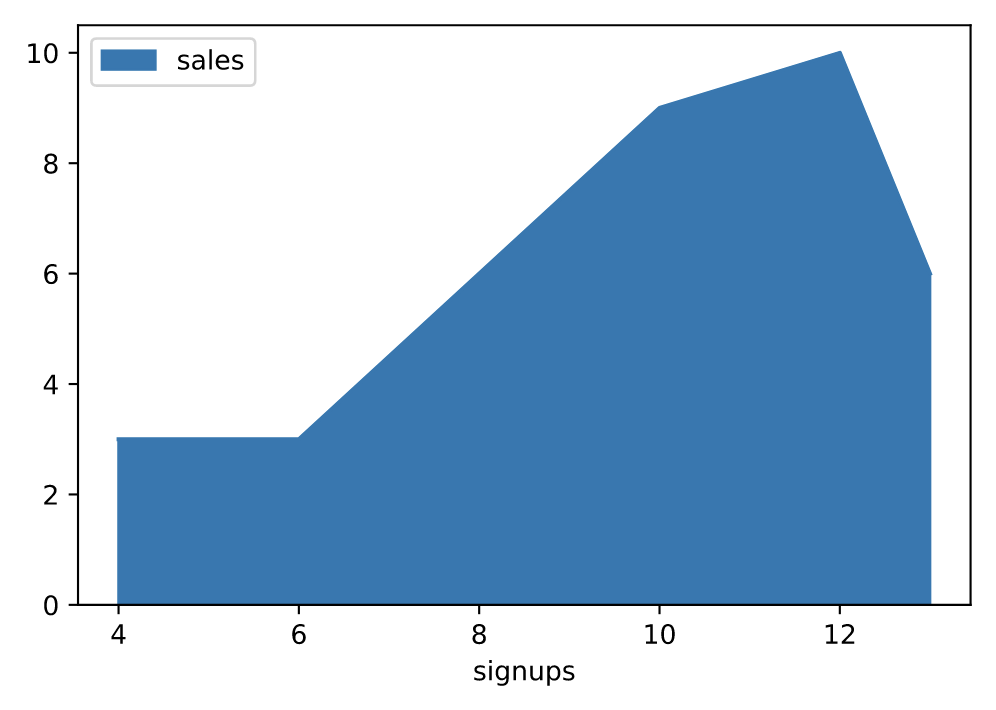
df = pd.DataFrame({ 'sales': [3, 3, 3, 9, 10, 6], 'signups': [4, 5, 6, 10, 12, 13], 'visits': [20, 42, 28, 62, 81, 50], }, index=pd.date_range(start='2018/01/01', end='2018/07/01', freq='M')) # 方法1,这种方法是高层API,需要制定kind df.plot(kind='area') # 方法2,这种方法是底层API df.plot.area()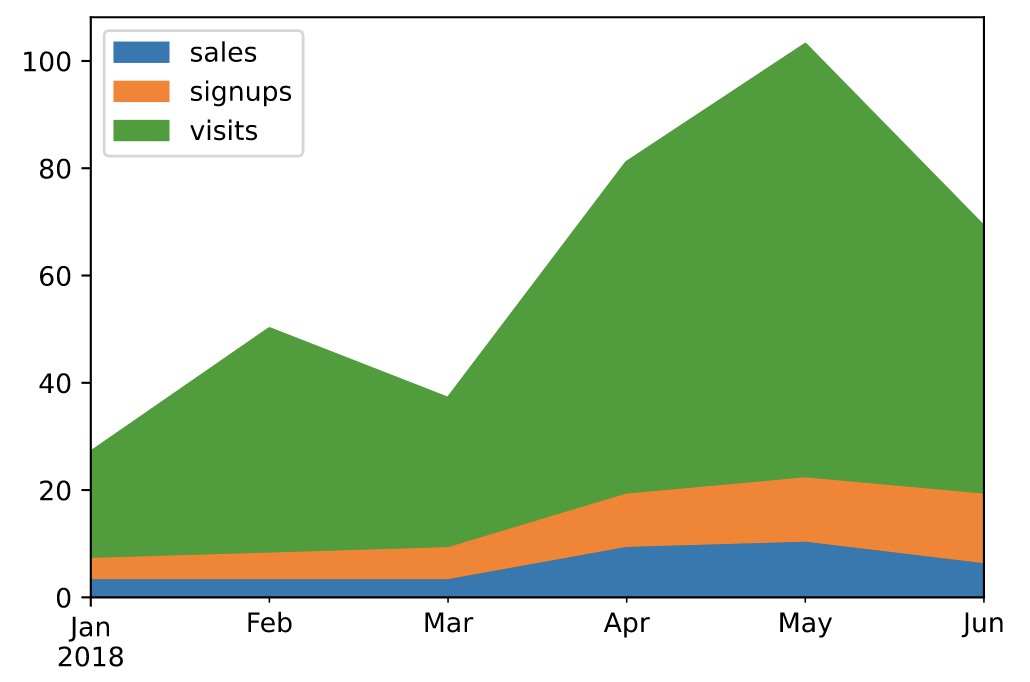
面积图(area)
面积图直观地显示定量数据下面的区域面积,该函数包装了 matplotlib 的area函数。
# 默认为面积堆叠 df.plot(kind='area')
# 设置面积不堆叠 df.plot.area(stacked=False)
# 手动指定坐标轴 df.plot.area(y='sales', x='signups')
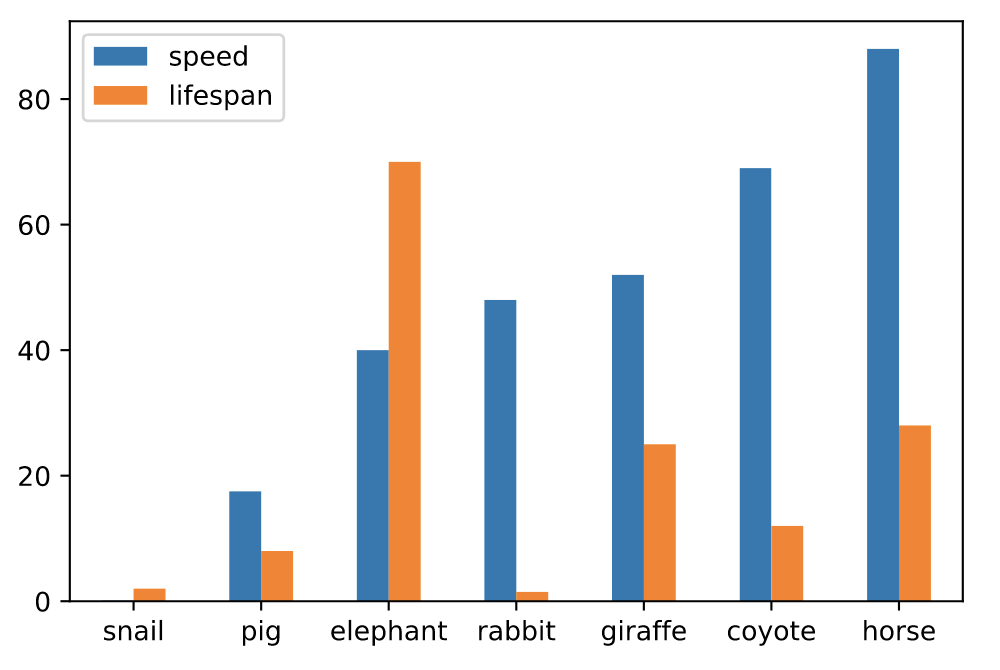
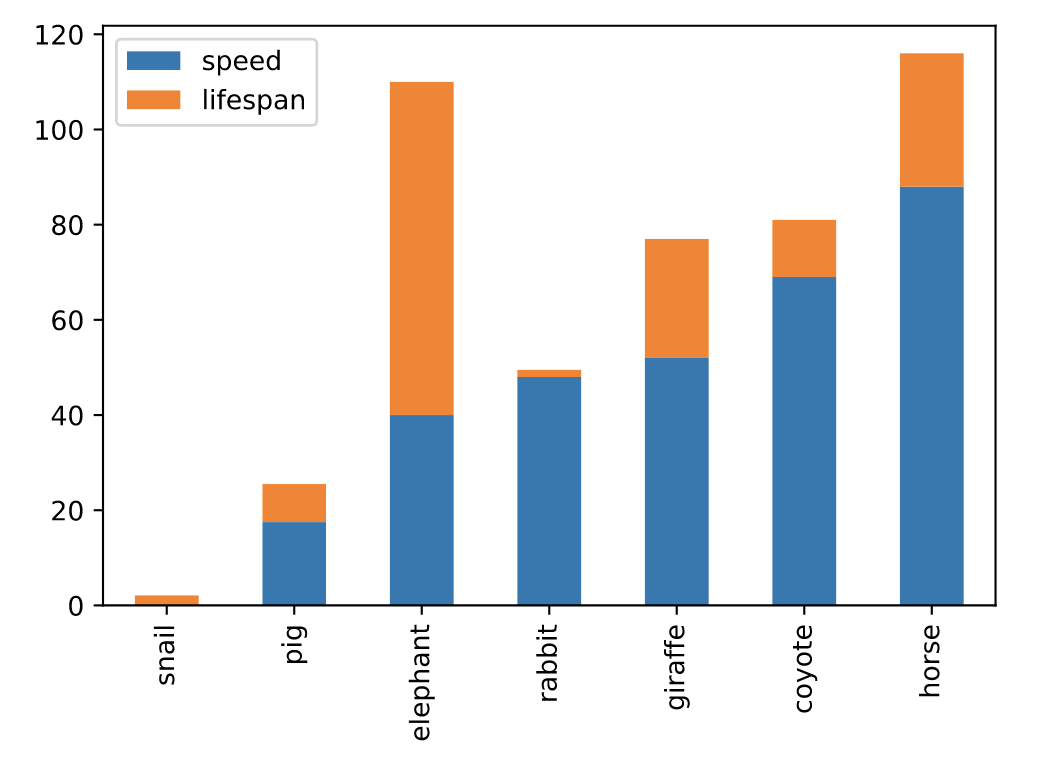
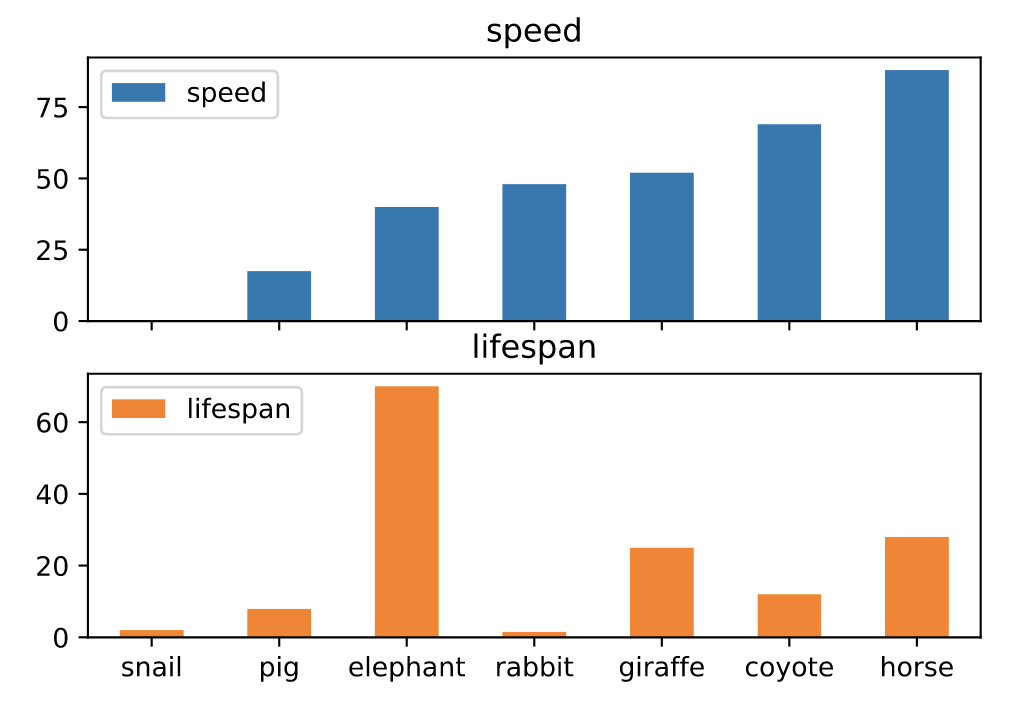
条形图(bar)
条形图是一种用矩形条显示分类数据的图,矩形条的长度与它们所代表的值成比例。条形图显示离散类别之间的比较。图的一个轴显示比较的特定类别,另一个轴表示测量值。
df = pd.DataFrame({'lab':['A', 'B', 'C'], 'val':[10, 30, 20]}) # 手动设置坐标轴 ax = df.plot.bar(x='lab', y='val', rot=0)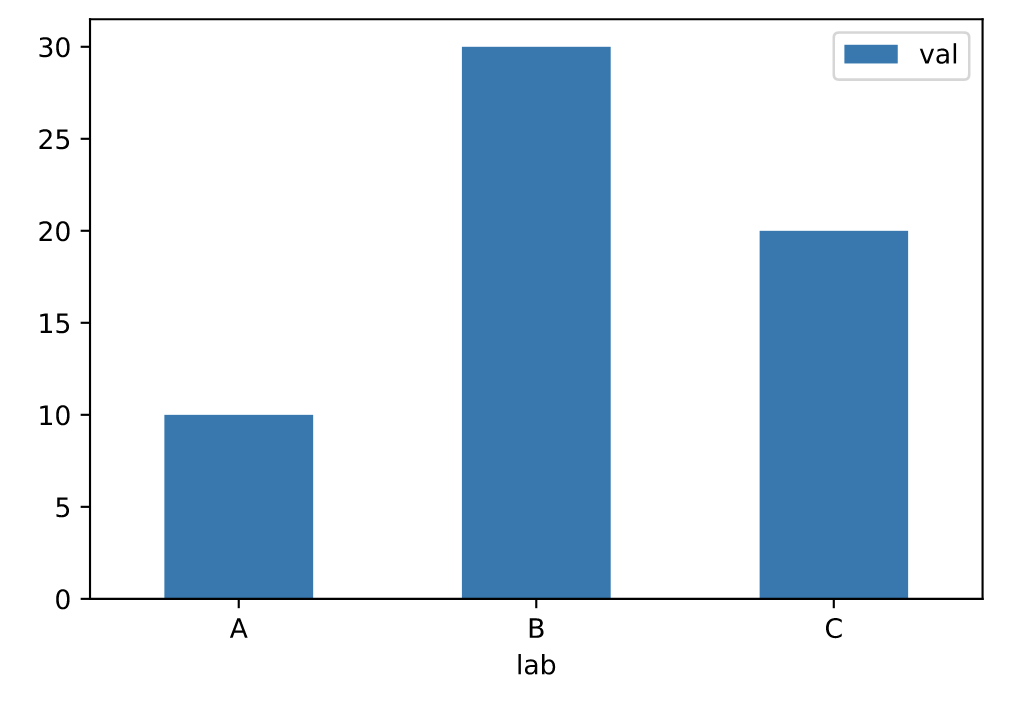
# 并排绘制 df.plot.bar(rot=0)
# 堆叠绘制 df.plot.bar(stacked=True)
# 分图绘制 axes = df.plot.bar(rot=0, subplots=True) axes[0].legend(loc=2) axes[1].legend(loc=2)
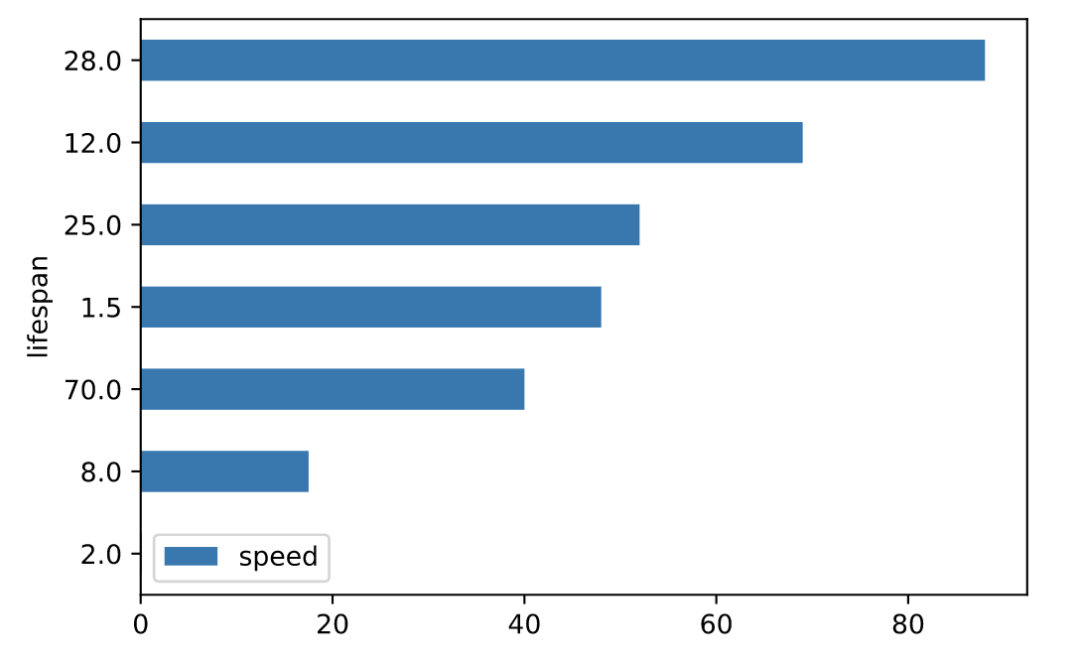
水平条形图(barh)
水平条形图是用矩形条形表示定量数据的图表,矩形条形的长度与它们所代表的值成正比。条形图显示离散类别之间的比较。
# 并排绘制 df.plot.barh(rot=0)
# 堆叠绘制 df.plot.barh(stacked=True)
箱线图(boxplot)
箱线图是一种通过四分位数以图形方式描绘数值数据组的方法。该框从数据的 Q1 到 Q3 四分位值延伸,在中位数 (Q2) 处有一条线。
age_list = [8, 10, 12, 14, 72, 74, 76, 78, 20, 25, 30, 35, 60, 85] df = pd.DataFrame({"gender": list("MMMMMMMMFFFFFF"), "age": age_list}) ax = df.plot.box(column="age", by="gender", figsize=(10, 8))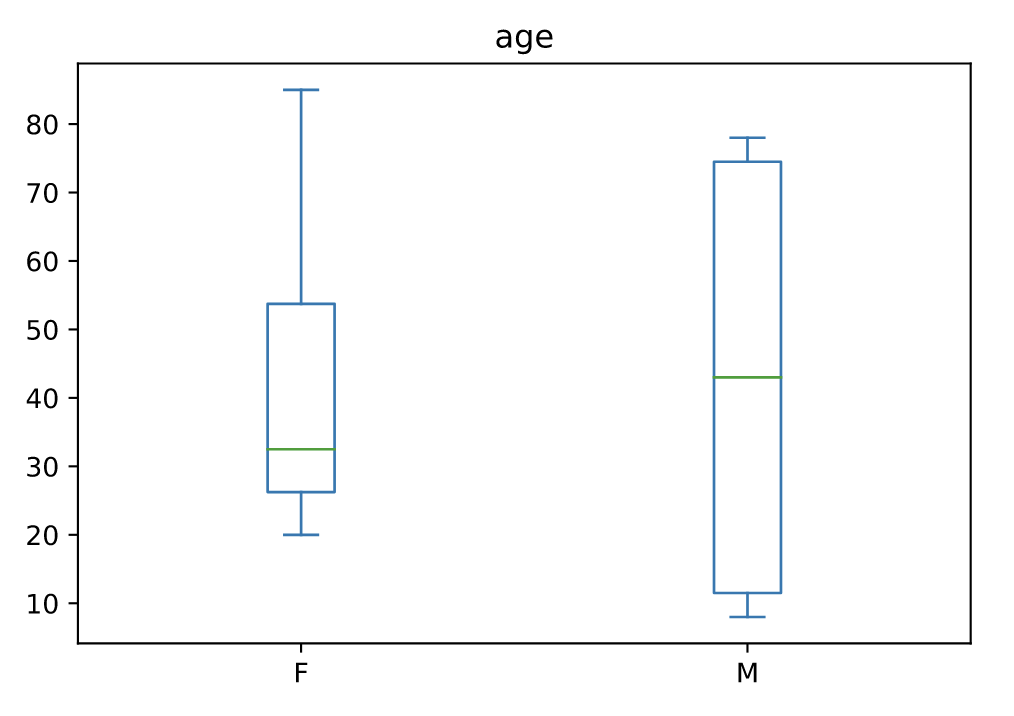
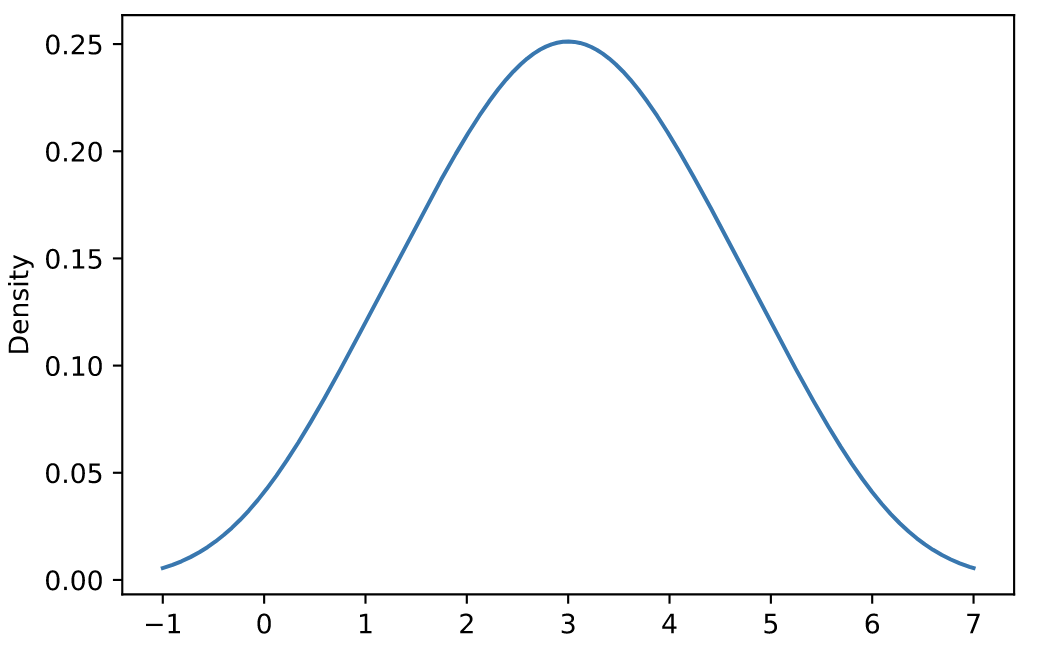
密度图(density)
核密度估计 (KDE) 是一种估计随机变量的概率密度函数 (PDF) 的非参数方法。
s = pd.Series([1, 2, 2.5, 3, 3.5, 4, 5]) ax = s.plot.kde()
df = pd.DataFrame({ 'x': [1, 2, 2.5, 3, 3.5, 4, 5], 'y': [4, 4, 4.5, 5, 5.5, 6, 6], }) ax = df.plot.kde()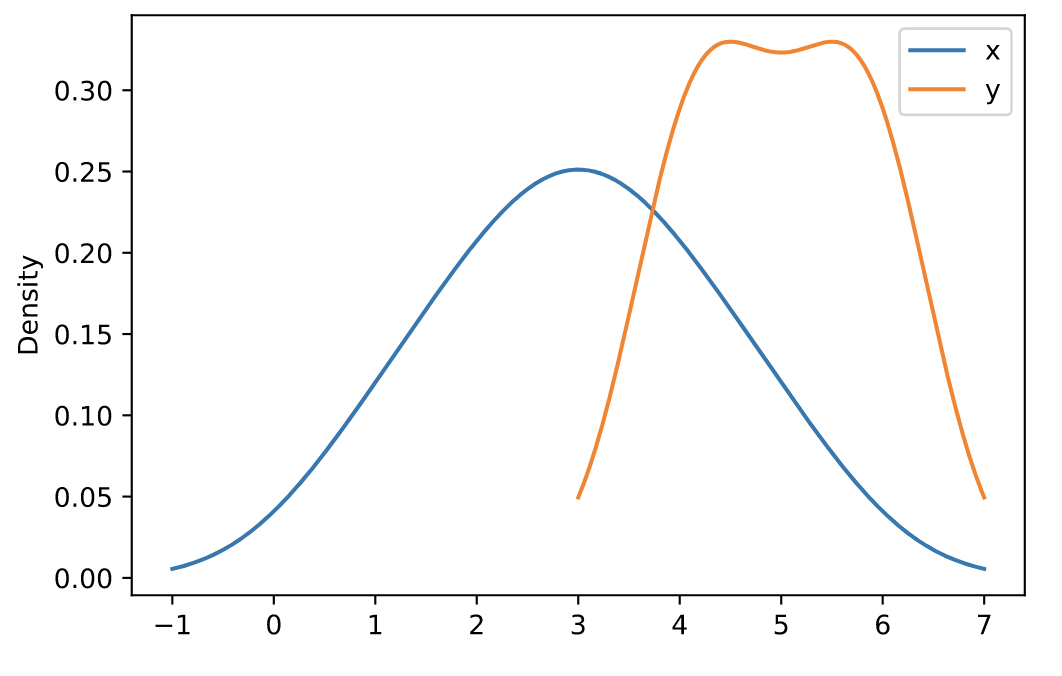
六边形图(hexbin)
和热力图类似,具体的颜色按照密度来进行展示。但形状使用六边形图代替。
n = 10000 df = pd.DataFrame({'x': np.random.randn(n), 'y': np.random.randn(n)}) ax = df.plot.hexbin(x='x', y='y', gridsize=20)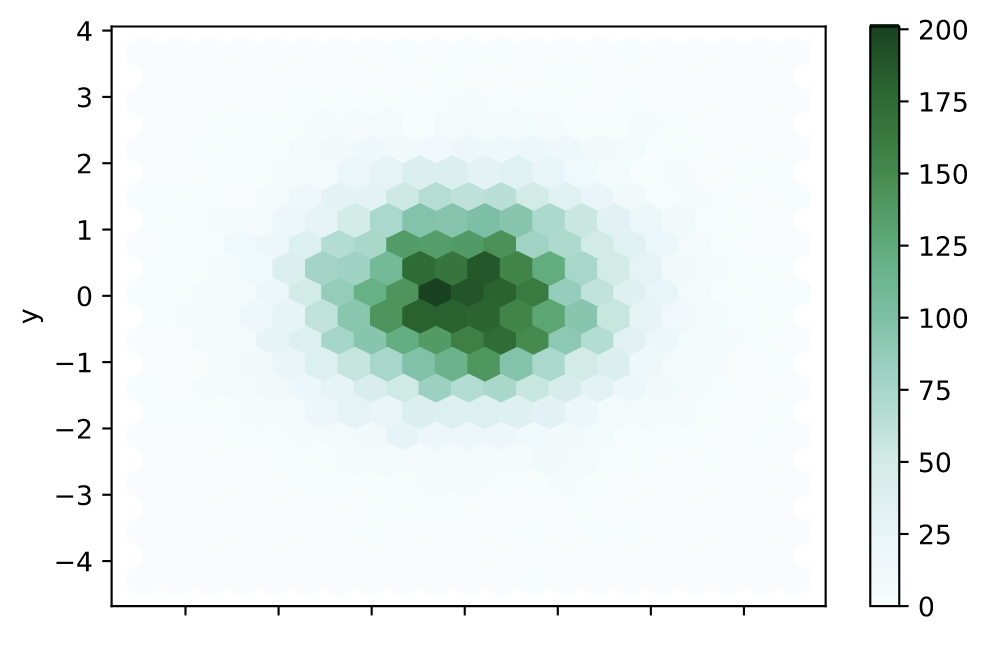
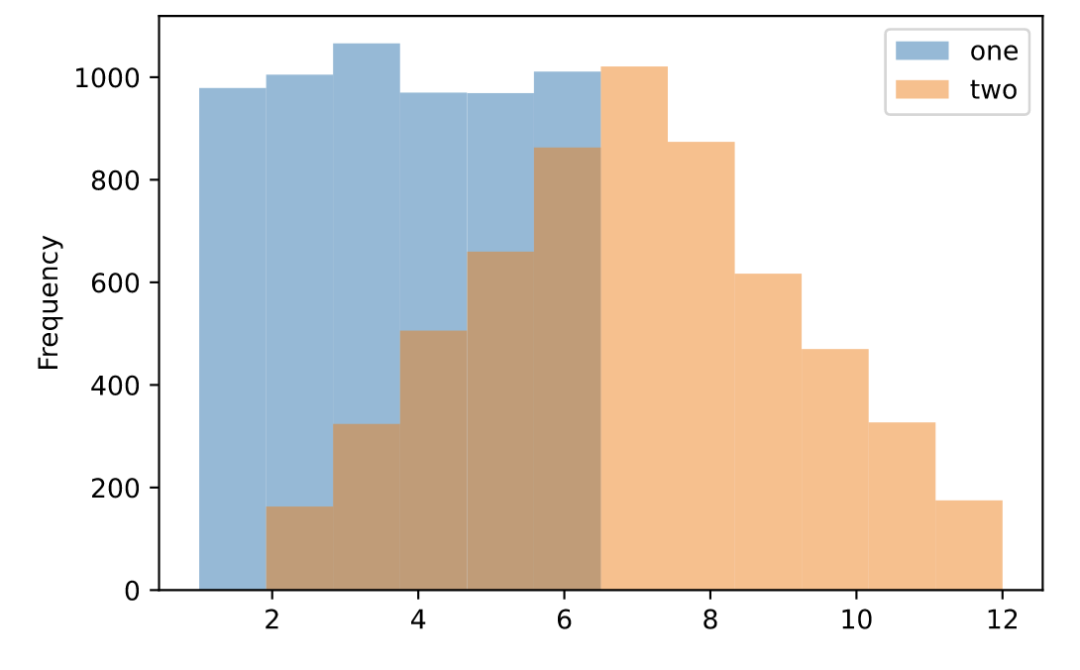
直方图(hist)
df = pd.DataFrame( np.random.randint(1, 7, 6000), columns = ['one']) df['two'] = df['one'] + np.random.randint(1, 7, 6000) ax = df.plot.hist(bins=12, alpha=0.5)
折线图(line)
s = pd.Series([1, 3, 2]) s.plot.line()

df = pd.DataFrame({ 'pig': [20, 18, 489, 675, 1776], 'horse': [4, 25, 281, 600, 1900] }, index=[1990, 1997, 2003, 2009, 2014]) lines = df.plot.line()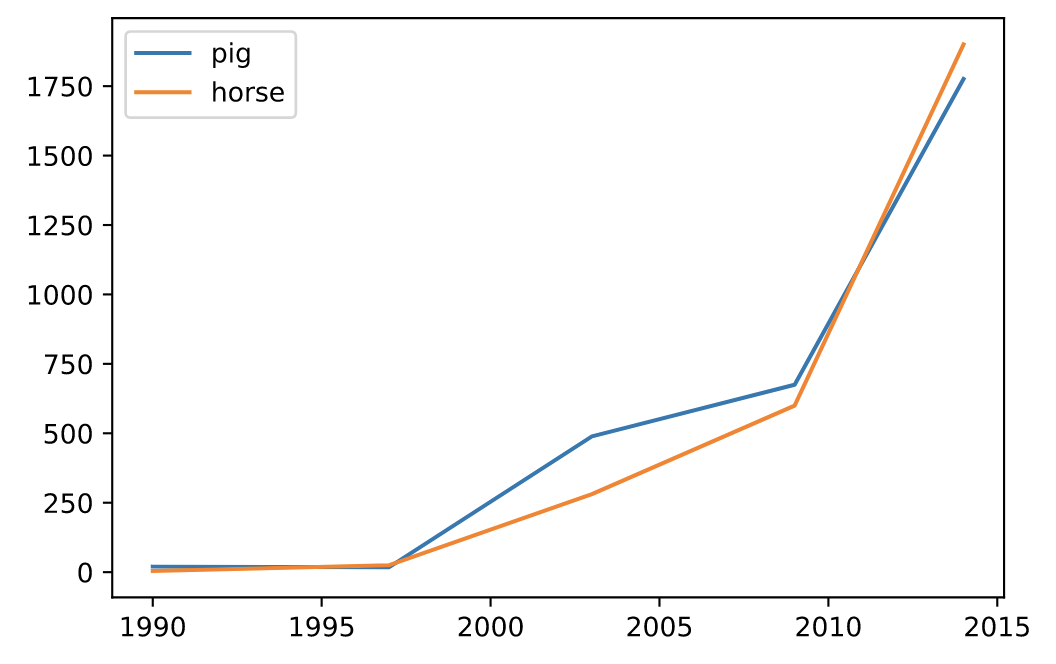
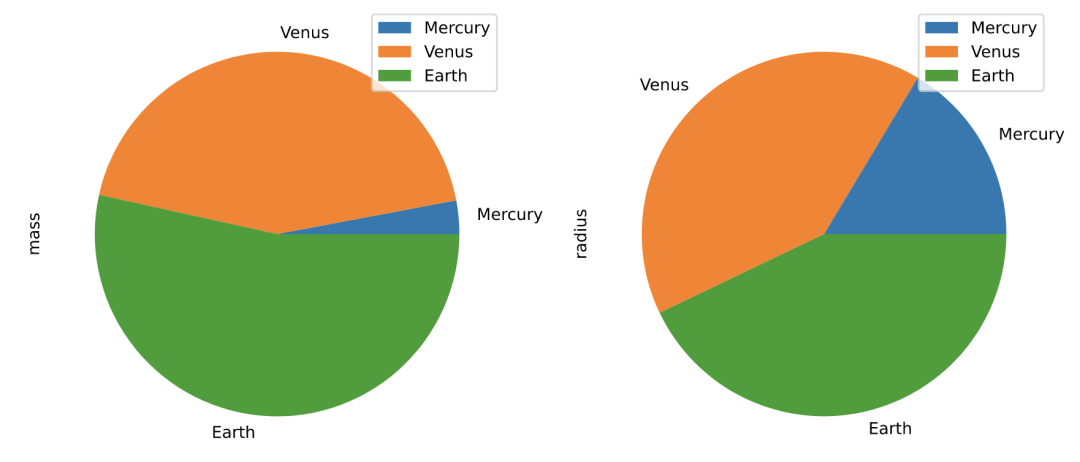
饼图(pie)
df = pd.DataFrame({'mass': [0.330, 4.87 , 5.97], 'radius': [2439.7, 6051.8, 6378.1]}, index=['Mercury', 'Venus', 'Earth']) plot = df.plot.pie(y='mass', figsize=(5, 5))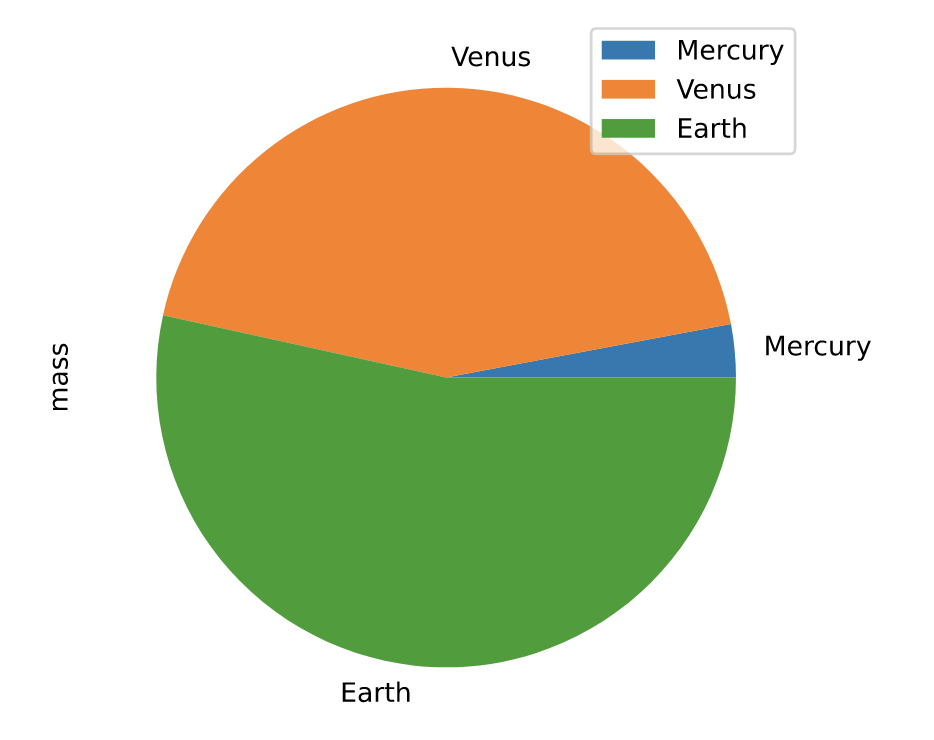
# 默认使用index进行分组 df.plot.pie(subplots=True, figsize=(11, 6))
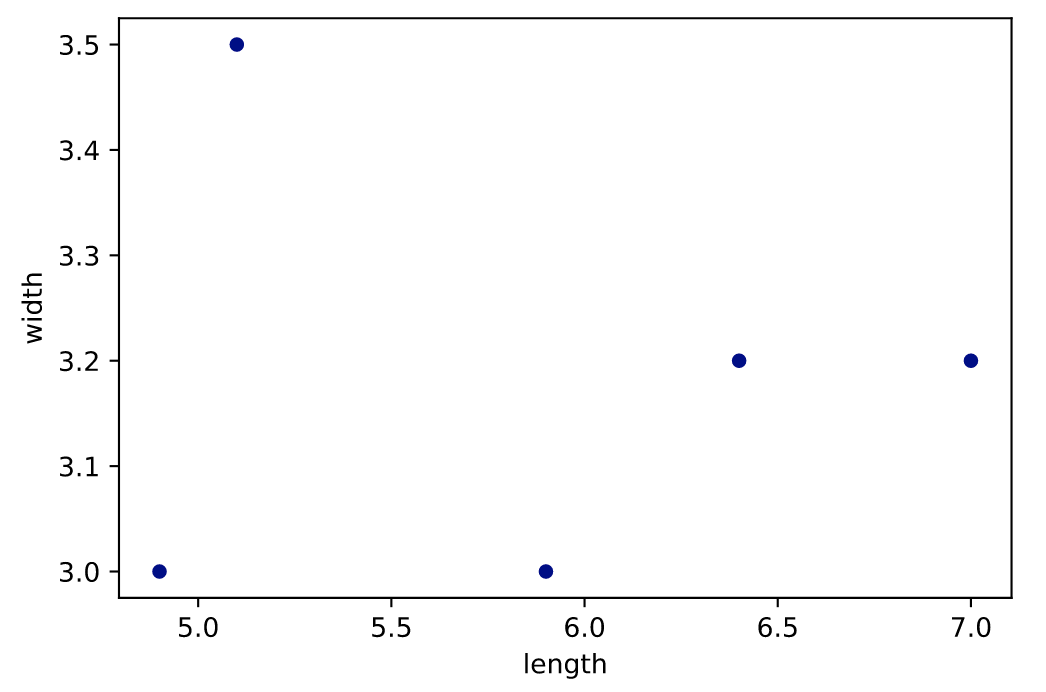
散点图(scatter)
df = pd.DataFrame([[5.1, 3.5, 0], [4.9, 3.0, 0], [7.0, 3.2, 1], [6.4, 3.2, 1], [5.9, 3.0, 2]], columns=['length', 'width', 'species']) ax1 = df.plot.scatter(x='length',y='width', c='DarkBlue')
到此这篇关于Pandas 内置的十种画图方法的文章就介绍到这了,更多相关Pandas 内置画图方法内容请搜索以前的文章或继续浏览下面的相关文章希望大家以后多多支持!
相关内容
- Python+Selenium实现浏览器的控制操作_python_
- Python实现一个发送程序和接收程序_python_
- Python文件读写及常用文件的打开方式_python_
- Python+ Flask实现Mock Server详情_python_
- Python 查看数据类型与格式_python_
- 解读python正则表达式括号问题_python_
- Python语言中Tuple的由来分析_python_
- Python实现简易超市管理系统_python_
- python pycharm中使用opencv时没有代码自动补全提示的解决方案_python_
- Python中__init__.py文件的作用_python_